|
Home |
| Latest release |
|
OVT v3.0 Download About User Guide Release Notes |
What is Orbit Visualization Tool ?
Orbit Visualization Tool (OVT) is a software designed for interactive 3D visualization of satellite orbits in the terrestrial magnetosphere.
The new version has the following functionality:
- Platform independent: It can be installed on Windows, Mac OS X, and Linux (see release notes).
- Modern computer graphics based on OpenGL, Java, VTK - nonproprietary graphics packages with interactive, mouse-maneuverable 3D graphics capabilities.
- Viewing of 3D magnetosphere, bow shock, magnetopause with surface rendering, satellite orbits, satellite footprints.
- Satellite tracks include CLUSTER and any other spacecraft which may be of interest for scientific studies. Cluster viewing includes zoom option to view the spatial configuration of the four spacecraft.
- A number of most recent magnetospheric models is implemented and used to compute footprints of the satellite projected both on the Earth surface and on the distant magnetosphere (or the equatorial plane).
- Online access to orbit data via NASA's Satellite Situation Center's (SSC) Web Services, and magnetospheric and solar wind data via NASA's Space Physics Data Facility's (SPDF) OMNI2 data.
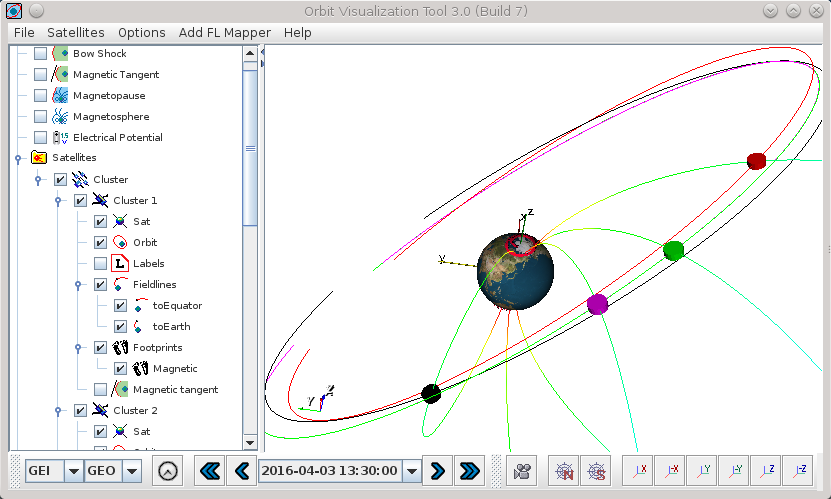
Here is a screenshot of OVT with a view of four Cluster s/c orbits.

For more details please see the User Guide to OVT.
The first version of OVT was made by K. Stasiewicz and it was used in a number of publications:
- K. Stasiewicz, New Methods and Techniques in Visualization and Mapping of Magnetospheric Boundaries, in Physical Signatures of Magnetospheric Boundary Layer Processes, (J. A. Holtet and A. Egeland, eds.), Kluwer Academic Publishers, 433-447, 1994.
- K. Stasiewicz, Magnetospheric Modeling in Support of Space Missions in Spatio-Temporal Analysis for Resolving Plasma Turbulence (START), Proceedings ESA WPP-047, p. 345, 1993
- K. Stasiewicz, Polar cusp topology and position as a function of IMF and magnetic activity: Comparison of a model with Viking and other observations, J. Geophys. Res., 96, 15789-15800, 1991.